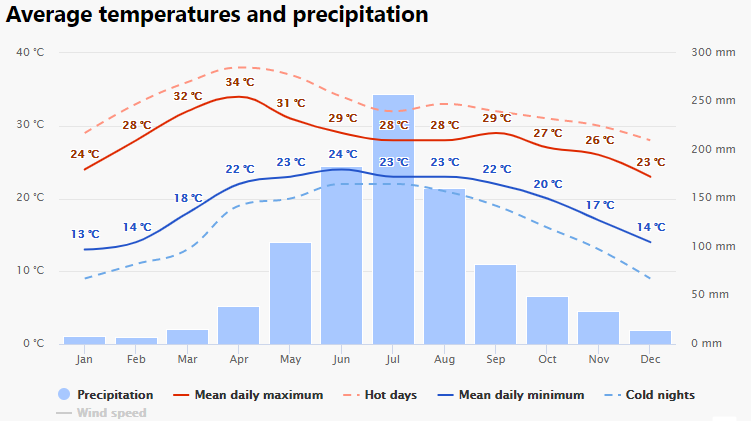
Deqin County Climate
Climate
The climate in Deqin County belongs to cold temperate mountain monsoon climate. The climate is greatly affected by altitude. The latitude effect is not obvious. As the altitude rises, the temperature decreases and the precipitation increases. Most of the seasons are unclear. The winter is long and the summer is short. The dry season and wet season are usually obvious. The average annual rainfall is 633.7 mm. The precipitation in the rainy season from May to October accounts for 77.5% of the annual precipitation. The annual average precipitation in the northwest is below 660 mm, and the annual average precipitation in the southeast is around 850 mm. The annual average temperature is 4.7°C, the annual maximum temperature is 25.1°C, the minimum temperature is -27.4 °C, the sunshine duration is 1980.7 hours, and the sunshine percentage is 4.5. The average first frost is on September 30, and the final frost is on May 23, the earliest frost is on August 28, and the latest frost is on June 12. The frost period is generally 236 days per year, and the frost free period is only 129 days. The Climate in Deqin Table as follows:
|
Climate data for Deqin County (1971−2000) |
|||||||||||||
|
Month |
Jan. |
Feb. |
Mar. |
Apr. |
May |
Jun. |
Jul. |
Aug. |
Sep. |
Oct. |
Nov. |
Dec. |
Year |
|
Record high °C (°F) |
13.9 (57) |
14.1 (57.4) |
17.2 (63) |
21.2 (70.2) |
22.9 (73.2) |
26.9 (80.4) |
23.9 (75) |
23.8 (74.8) |
23.8 (74.8) |
20.4 (68.7) |
15.8 (60.4) |
14.9 (58.8) |
26.9 (80.4) |
|
Average high °C (°F) |
4.1 (39.4) |
4.5 (40.1) |
6.8 (44.2) |
10.1 (50.2) |
15.0 (59) |
17.9 (64.2) |
18.1 (64.6) |
17.7 (63.9) |
15.9 (60.6) |
12.8 (55) |
8.8 (47.8) |
5.6 (42.1) |
11.4 (52.6) |
|
Daily mean °C (°F) |
−2.1 (28.2) |
−1.2 (29.8) |
1.2 (34.2) |
4.3 (39.7) |
9.0 (48.2) |
12.4 (54.3) |
12.7 (54.9) |
12.4 (54.3) |
10.6 (51.1) |
6.9 (44.4) |
2.4 (36.3) |
−0.8 (30.6) |
5.7 (42.3) |
|
Average low °C (°F) |
−6.2 (20.8) |
−5 (23) |
−2.4 (27.7) |
0.6 (33.1) |
4.7 (40.5) |
8.6 (47.5) |
9.6 (49.3) |
9.4 (48.9) |
7.7 (45.9) |
3.3 (37.9) |
−1.6 (29.1) |
−5 (23) |
2.0 (35.6) |
|
Record low °C (°F) |
−13.3 (8.1) |
−11.5 (11.3) |
−8.4 (16.9) |
−4.7 (23.5) |
−1.6 (29.1) |
2.7 (36.9) |
3.6 (38.5) |
4.0 (39.2) |
−0.1 (31.8) |
−2.8 (27) |
−11.5 (11.3) |
−12 (10) |
−13.3 (8.1) |
|
Average precipitation mm (inches) |
8.8 (0.346) |
19.0 (0.748) |
52.3 (2.059) |
56.8 (2.236) |
47.0 (1.85) |
60.8 (2.394) |
118.5 (4.665) |
112.2 (4.417) |
73.1 (2.878) |
46.9 (1.846) |
19.8 (0.78) |
6.9 (0.272) |
622.1 (24.491) |
|
Average precipitation days (≥ 0.1 mm) |
6.5 |
10.2 |
14.4 |
13.4 |
12.4 |
15.5 |
21.6 |
20.7 |
15.9 |
9.1 |
5.3 |
3.6 |
148.6 |
|
Average relative humidity (%) |
57 |
65 |
72 |
73 |
70 |
77 |
83 |
83 |
82 |
74 |
62 |
54 |
71.0 |
|
Mean monthly sunshine hours |
191.1 |
159.6 |
168.2 |
161.0 |
190.9 |
157.9 |
125.1 |
133.5 |
133.4 |
179.1 |
191.2 |
198.3 |
1,989.3 |
|
Percent possible sunshine |
59 |
51 |
45 |
42 |
46 |
38 |
29 |
33 |
36 |
5 |
Best Time to Visit Deqin
The best time to visit Deqin is from March to May and June to August. In the former three months from March to May, you can enjoy the view in Spring, such as the lakes, meadows, pastures, and flowers. The sceneries are too beautiful to describe in words. You can feel the different beauty in person. In the latter three months from June to August, in the summer, you can go boating on the lake or enjoy the lake and mountains along the plank road alongside the cliffs.

 7 Days GolfingTour
 8 Days Group Tour
 8 Days Yunnan Tour
 7 Days Shangri La Hiking
 11 Days Yunnan Tour
 6 Days Yuanyang Terraces
 11 Days Yunnan Tour
 8 Days South Yunnan
 7 Days Tea Tour
 8 Days Muslim Tour
 12 Days Self-Driving
 4 Days Haba Climbing
 Tiger Leaping Gorge
 Stone Forest
 Yunnan-Tibet
 Hani Rice Terraces
 Kunming
 Lijiang
 Shangri-la
 Dali
Dali
 XishuangBanna
 Honghe
 Kunming
 Lijiang
 Shangri-la
 Yuanyang Rice Terraces
 Nujiang
 XishuangBanna
 Spring City Golf
 Snow Mountain Golf
 Stone Mountain Golf


